Graph Odoo Request Duration with Loki#
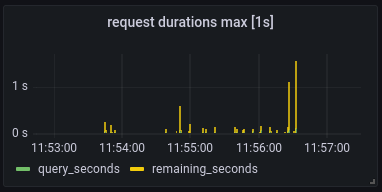
Before trying to improve performance, it is a good idea to measure. We want a graph that shows us request durations segmented by query time (the time it takes Postgres to gather the data) and remaining time (how long it takes Python/Odoo to do things with the data), like this:

Understanding the Log Lines#
Odoo 15 defines the log format as
%(asctime)s %(pid)s %(levelname)s %(dbname)s %(name)s: %(message)s %(perf_info)s
with perf_info defined as
query_count, query_time, remaining_time
So a log line like this
2023-10-17 10:20:45,053 1707305 INFO odoo werkzeug: 1.2.3.4 - - [17/Oct/2023 10:20:45] "POST /web/dataset/search_read HTTP/1.0" 200 - 20 0.012 0.033
Gives you:
field |
value |
|---|---|
|
|
|
|
|
|
|
|
|
|
|
|
|
|
|
|
|
|
Note:
nameis the logger name as defined in Python loggings‘ LogRecord attributes.messagein this case is a Common Log Format message
Loki Pattern Query#
Use Lokis pattern parser to parse lines into fields:
{job="varlogs",filename="/var/log/daemon.log"}
  | pattern `<dt> <time> <pid> <level> <dbname> <logger>: <ip> <_> <_> [<_>] "<method> <path> <_>" <status> <_> <queries> <query_seconds> <remaining_seconds>`
Graphing#
Our first Series unwraps by query_seconds and aggregates via max_over_time
over $__interval. The outside max function aggregates over
the remaining dimensions, as we are only interested in the highest value of the
duration in query_seconds.
max(max_over_time(
  {job="varlogs",filename="/var/log/daemon.log"}
  | pattern `<dt> <time> <pid> <level> <dbname> <logger>: <ip> <_> <_> [<_>] "<method> <path> <_>" <status> <_> <queries> <query_seconds> <remaining_seconds>`
  | unwrap query_seconds
  [$__interval]
))
Then
add another query for
remaining_secondsset title to
request durations max [$__interval]set bar chart
set stack series: normal
set unit to
seconds (s)
An that’s it! 📊
[unwrap]: